
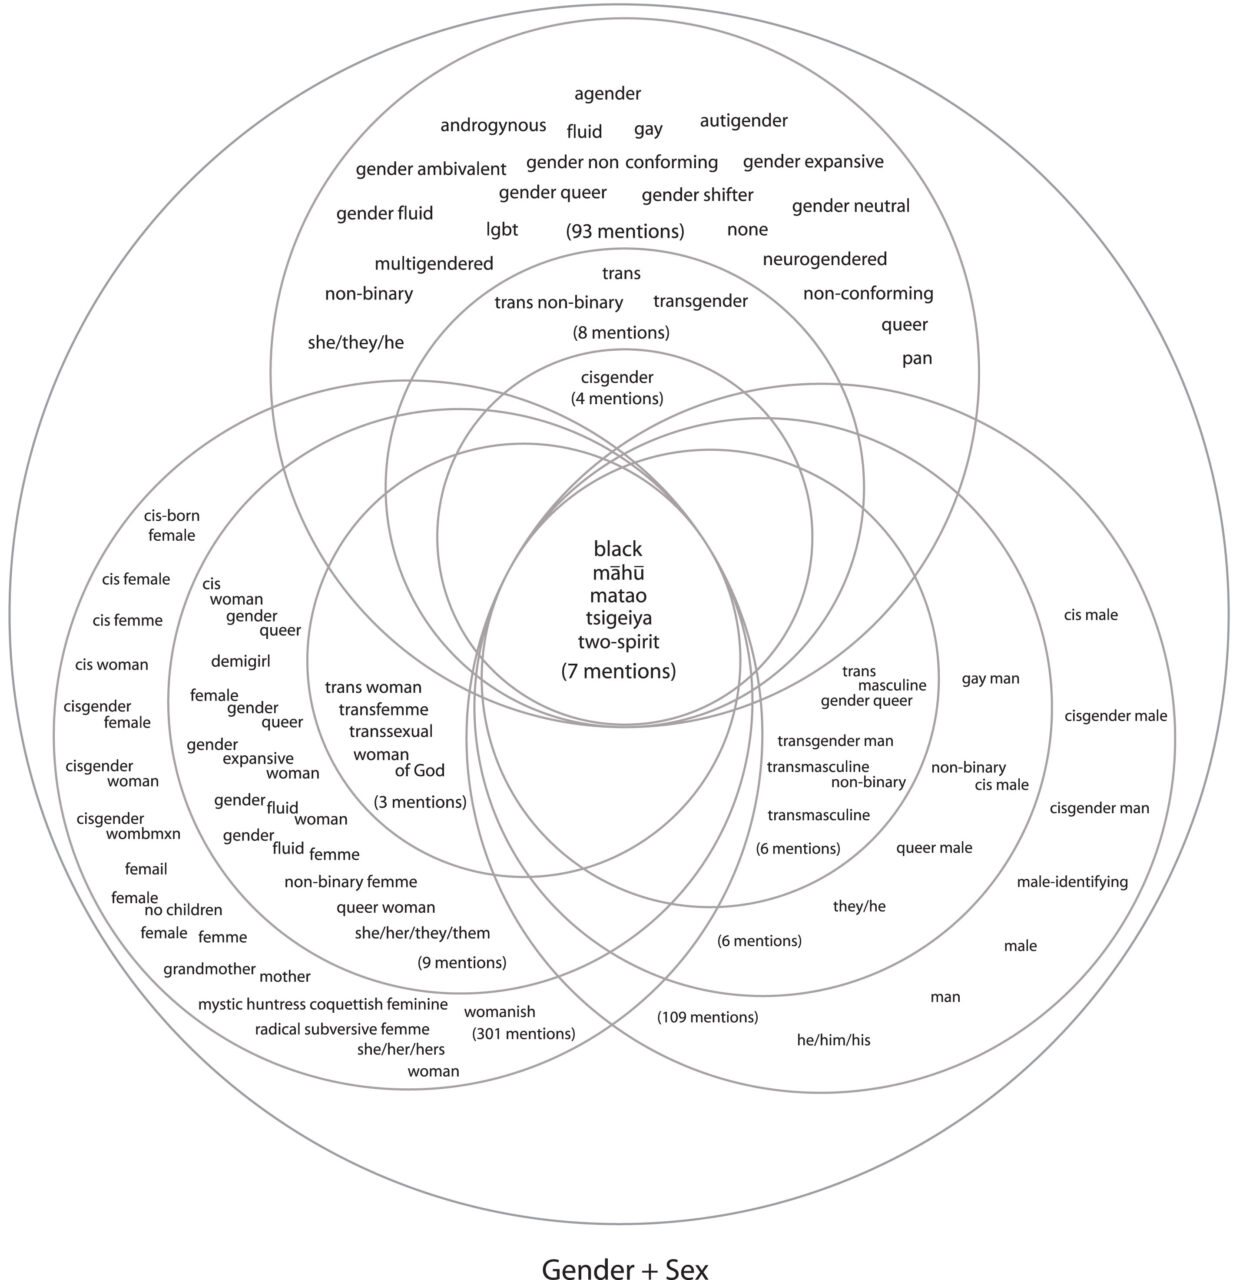

Gender and Sex Data
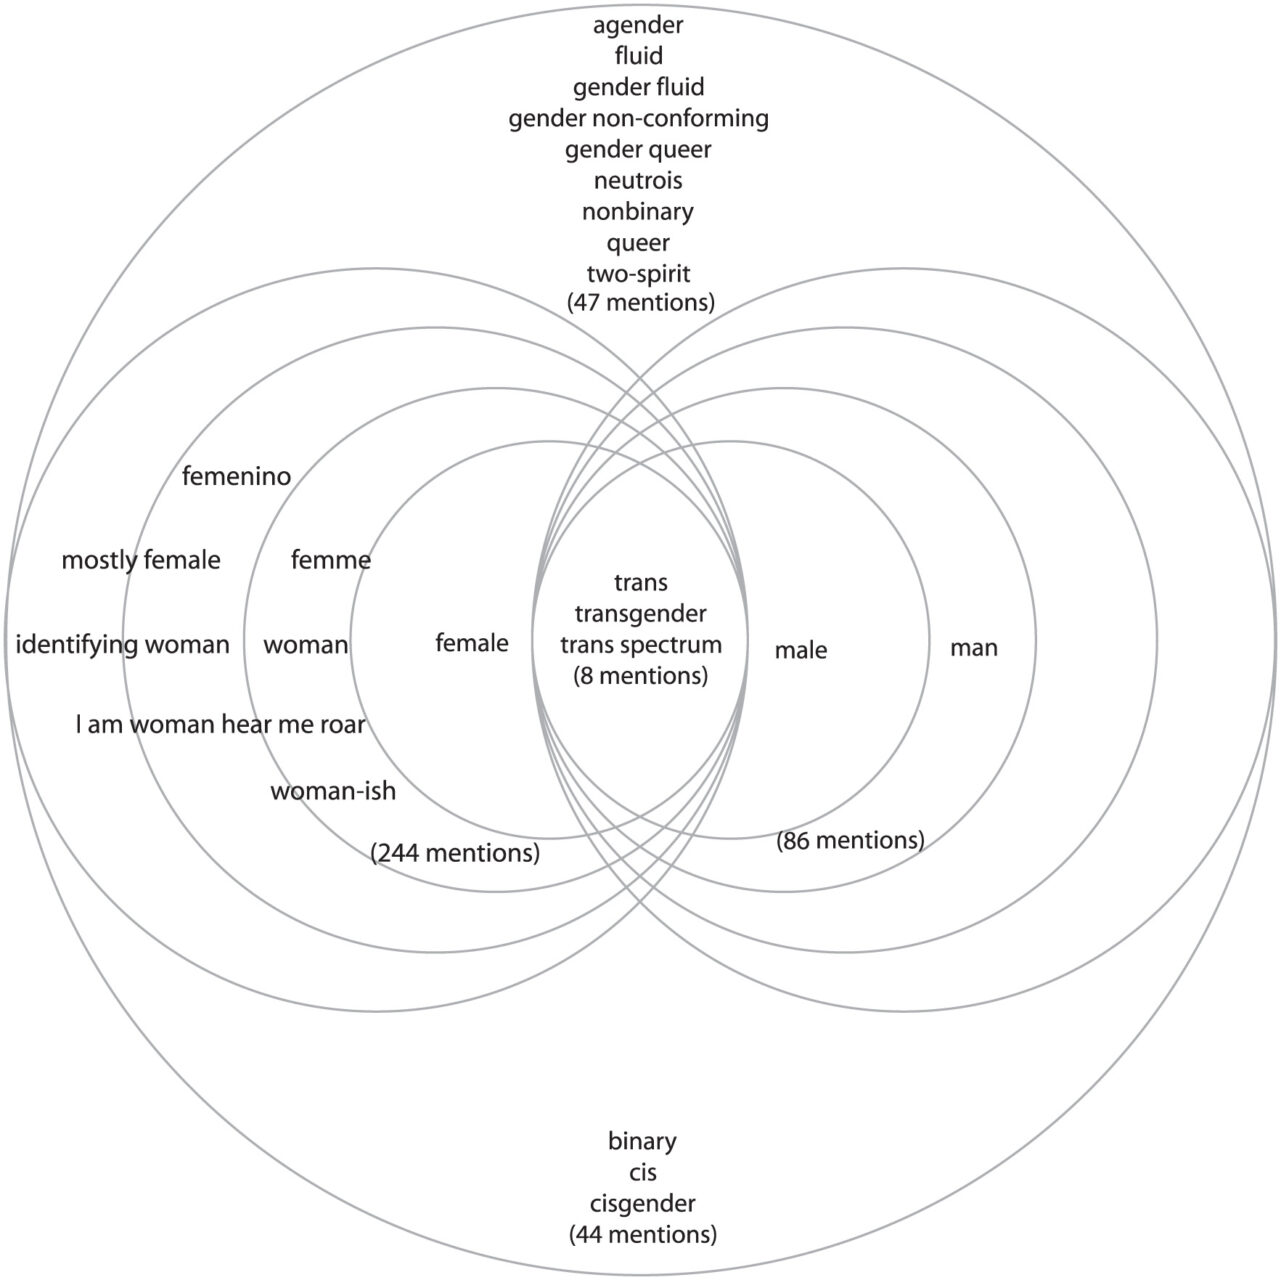
Two sets of overlapping concentric circles with “female”, “femme”, “woman” (mostly female, femenino, identifying woman, I am woman hear me roar, woman-ish) representing one side with 244 mentions and “male” and “man” representing the other with 86 mentions. The overlapping middle represents terms “trans”, “transgender” and “trans spectrum” with 8 mentions. Above but outside the overlapping circles are words agender, fluid, gender-fluid, gender nonconforming, genderqueer, neutrois, nonbinary, queer, and two-spirit (47 mentions). Below and outside the circles are binary, cis, cisgender (44 mentions). Credit info: Gender/Sex mentions from original applicant pool (Round two) Data visualization chart created by Gene Pendon (design) and Michèle Steinwald (data).
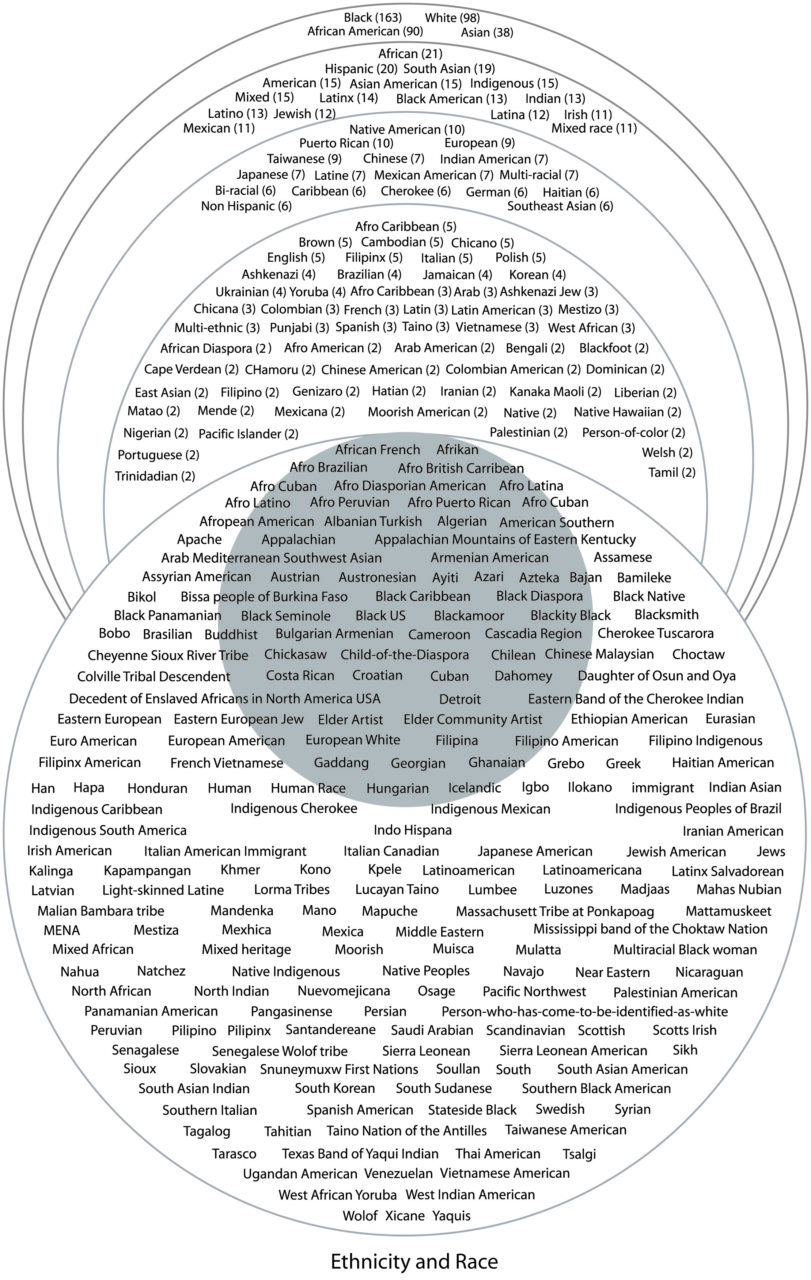
Race and Ethnicity Data
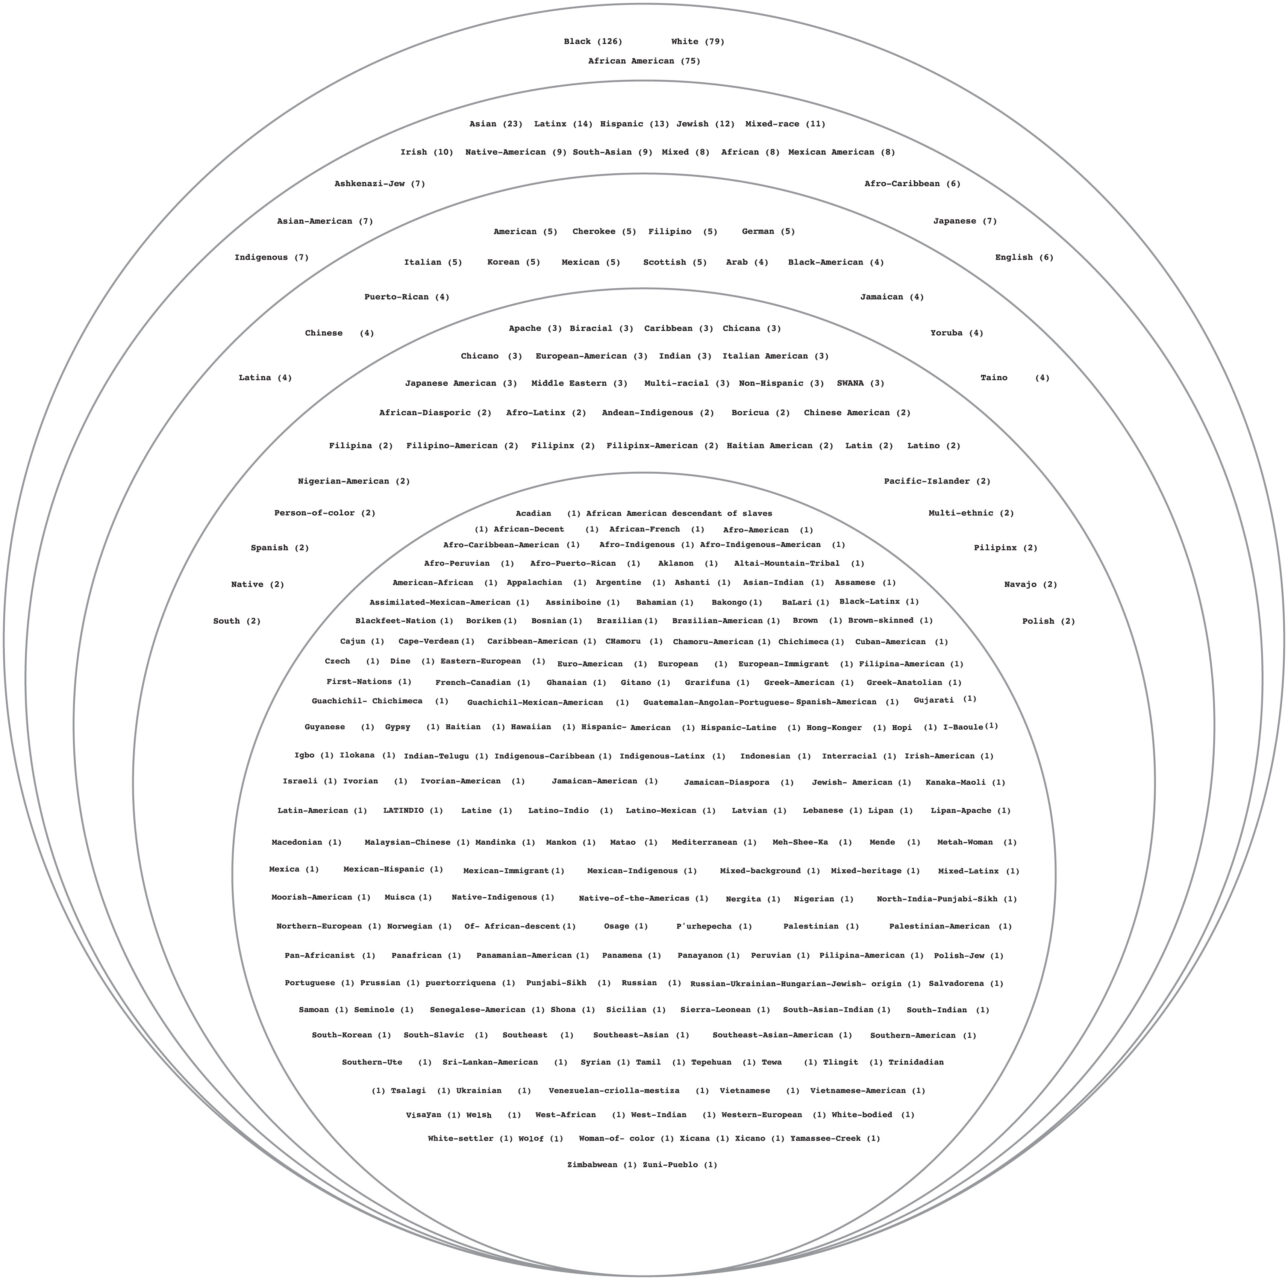
A chart of 246 race and ethnicities, layered in five concentric circles. Text that represents a race/ethnicity is coupled with a number representing the number of times this race/ethnicity is mentioned in the application forms. The outmost layers represent the highest-number mentions (Black, white, and African-American), the inner-most circle represents race/ethnicities only mentioned once. Credit info: Race/Ethnicity mentions from original applicant pool (Round two). Data visualization chart created by Gene Pendon (design) and Michèle Steinwald (data). Please contact the program team for the full text list of terms.
Dance Form and Genre Data

A chart of over 383 dance genres, forms, and techniques, layered in six concentric circles. Text that represents a dance genre is coupled with a number representing the number of times this genre is mentioned in the application forms. The outmost layers represent genres with the highest-number mentions, except for the largest circle which represents the terms that are used as either nouns or adjectives. The inner-most circle represents genre/forms only mentioned once. Credit info: Dance form/genre mentions from original applicant pool (Round two) Data visualization chart created by Gene Pendon (design) and Michèle Steinwald (data).